Best Mutual Funds?
‘Best Mutual Fund’ is one of the most common question/search term in personal finance. There are tons of sites that offer a list of Best Mutual Funds, Best Largecap Funds, Best Liquid Funds, etc. Most, but not all, of these sites also list the parameters that they have used to come up with their selection. An earlier post – Best Mutual Funds – Selection Guide– looked at some parameters that can be used to shortlist ‘better’ equity mutual funds. In this long article we would look at a detailed way to shortlist mutual funds using the information available at ValueResearch Online. (VRO)
If you want a quick and easy way to select funds, please use CRISIL Ranking.
First Things First
-
The financial goal that you have
-
Time available to build the corpus
-
Your expected return
-
Your tolerance to volatility
-
Your ability to stay invested and stay focused
-
and more…
Evaluating Mutual Funds
Let us assume that you have done the first things and have picked one category of mutual funds as appropriate to invest in. You can then use these parameters to arrive at a list of ‘best funds’ in that category:
-
Fund Age
-
Trailing Returns
-
Risk-Return measures
-
Annual Returns
-
Minor factors – AUM size, Expense Ratio, Portfolio Turnover
Detailed approach to apply these factors
Like most lists, the list of parameters is also subjective – particularly the age of the fund. Focusing on funds with long history penalizes newer funds – some of which may have excellent processes and investment mandates. But for the popular categories like large cap, ELSS, Balanced (now Hybrid Aggressive), etc. it would be useful to start with funds that have a long track record.Once a short list has been made, AUM size and TER can be looked at to trim the list to a handful.
Get a list of well performing funds
It helps a lot if you do this category by category. The procedure below uses the popular ELSS category as an example. Due to the way VRO organizes the information, the steps would also be applicable if you look at the entire category of equity funds.
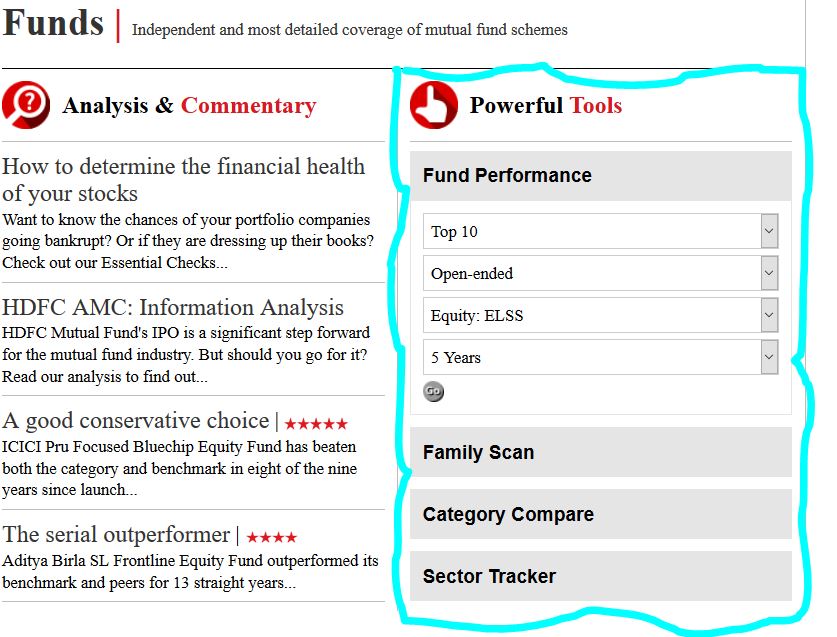
There is more than one way to get an ordered list of performing funds. In this illustration, we would use the ‘Fund Performance’ selector, which is right at the top of the list of ‘Powerful Tools’. You can also choose the Fund Rankings selector.
- Go to the VRO funds site.
- Look at the list of ‘Powerful Tools’
- Click on ‘Fund Performance’ selector if it is not open already
- Choose ‘Top 10’, ‘Open-ended’, ‘Equity – ELSS’, and ‘5 years’ in the four boxes
- Click ‘Go’

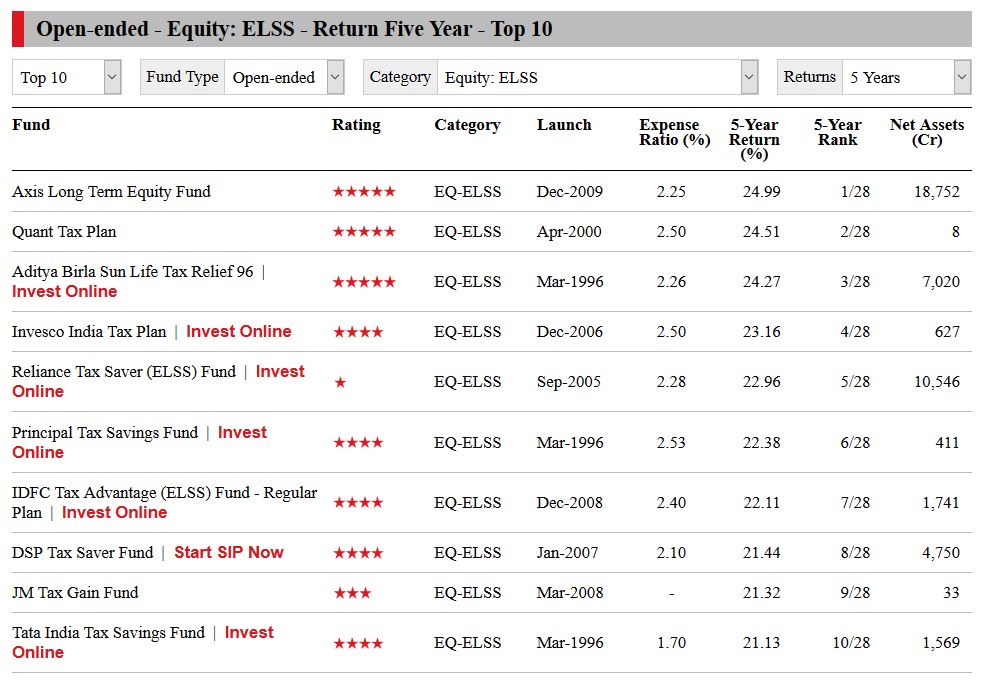
The result is as shown below.

Some interesting points to note.
- The list shows only regular plans. This is OK since we are looking at relative performance of funds. We can make an assumption that the difference between returns of direct vs regular plans is reasonably uniform across the funds.
- The list is in descending order of 5-year returns. So we have in fact applied the first two parameters to an extent.
- The rank column indicates that the list has 28 funds overall. So we are looking at the top 40% of the funds. (Do note that almost every AMC has an ELSS fund! We see fewer because we are looking at 5 year or older funds.)
- The star ratings are all over the place! We would ignore them for now.
- Let us apply one of the minor factors – AUM size – to discard some of the very low AUM funds like Quant Tax Plan, JM Tax Gain Fund, etc.
- You can visually choose a few from the list. e.g Axis LTE, ABSL Tax Relief, Reliance Tax Saver, DSP Tax Saver
Apply the risk-return parameter
These steps have to be done for each fund separately. So iterate through them for each shortlisted fund.
- Click on the fund name
- The Snapshot view is interesting. Don’t look at it, yet.
- Click on the ‘Performance’ tab and scroll to the middle to see the Risk Measures
- We would like Sharpe and Sortino to be at least 1.2x of the category, and if possible above that of the TRI benchmark
- We would like Alpha to be higher than that of the category
For Reliance Tax Saver, the table looks like this.
Risk Measures (%) Mean Std Dev Sharpe Sortino Beta Alpha Fund 11.52 17.90 0.28 0.42 1.21 -6.19 NIFTY 100 TRI 15.34 13.32 0.67 1.13 – – Category 13.88 14.29 0.52 0.76 0.98 -1.68 Rank within Category 25 1 27 27 1 28 Number of funds in category 29 29 29 29 29 29 As on Aug 31, 2018. The Risk Measures have been calculated using calendar month returns for the last three years.
The values are definitely un-inspiring. This also shows up in the rank. The fund has shown high volatility in the category. So this fund should be off the short list.
For ABSL Tax Relief, the table looks like this:
Risk Measures (%) Mean Std Dev Sharpe Sortino Beta Alpha Fund 16.14 13.21 0.74 0.97 0.89 1.45 NIFTY 200 TRI 15.56 13.54 0.67 1.10 – – Category 13.88 14.29 0.52 0.76 0.98 -1.68 Rank within Category 4 24 3 4 24 3 Number of funds in category 29 29 29 29 29 29
Sharpe, Sortino, and Alpha are quite good, compared to the category. Comparison to the benchmark is a bit mixed, but not bad. (Please note that the benchmark here is Nifty 200 TRI.)
The table for DSP Tax Saver fund
Risk Measures (%) Mean Std Dev Sharpe Sortino Beta Alpha Fund 15.27 15.05 0.59 0.95 1.05 -0.93 NIFTY 500 TRI 15.73 13.76 0.68 1.08 – – Category 13.88 14.29 0.52 0.76 0.98 -1.68 Rank within Category 9 8 11 7 7 11 Number of funds in category 29 29 29 29 29 29
The values are better than the category, but not that much better. Again the rank indicates this. Do note that this fund has lower absolute returns than Reliance Tax Saver, but scores better in risk-return parameters.
And finally, let us look at the values for the very popular Axis LTE:
Risk Measures (%) Mean Std Dev Sharpe Sortino Beta Alpha Fund 14.56 12.64 0.64 0.86 0.86 0.15 NIFTY 200 TRI 15.56 13.54 0.67 1.10 – – Category 13.88 14.29 0.52 0.76 0.98 -1.68 Rank within Category 12 27 8 10 25 7 Number of funds in category 29 29 29 29 29 29 As on Aug 31, 2018. The Risk Measures have been calculated using calendar month returns for the last three years.
The fund has the best 5-year return. Sharpe and Sortino are better than the category, but not by much. As you would see in the next section, the fund had one bad year in the recent past. This affects the risk-return measures as they are calculated for 3 years.
Annual Returns, Consistency of returns
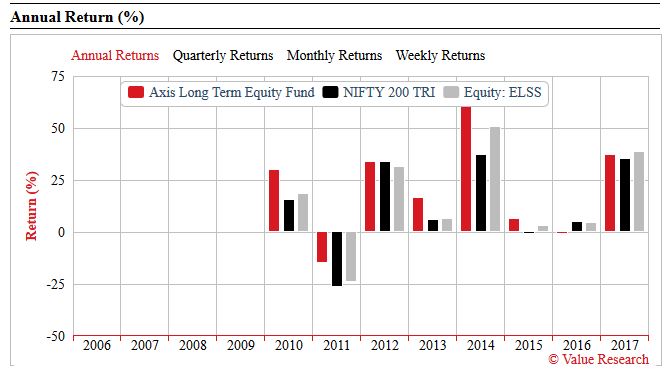
In the same tab, look at the Annual Returns graph. For Axis LTE, the graph looks like this:
As you can, the fund performed better, or at par with the benchmark and the category in all years, except in 2016. This also shows up in the rank for the various periods in the Trailing Returns table. Before looking at that, note the superior performance of the fund in the 2011 bear year. The downside protection is excellent for this fund and this can be more important than outperformance during bull phases.
Trailing Returns (%) YTD 6-M 1-Y 3-Y 5-Y 7-Y 10-Y Fund 8.08 11.07 13.95 14.17 24.99 20.47 – NIFTY 200 TRI 6.53 9.56 12.92 15.44 17.76 14.71 – Category -0.93 4.14 6.32 13.22 20.08 15.91 – Rank within Category 1 1 4 12 1 1 – Number of funds in category 35 35 35 35 35 35 34 30 28 26 – As on Sep 14, 2018
(The 1-day, 1-w, etc columns have been intentionally removed.) The fund rank nears the top of the category for 6M, 1Y, 5Y, and 7Y. It falls near the middle only for the 3Y period. So this fund can definitely be in the short list.
The same metrics for ABSL Tax Relief show a more consistent performance.
Trailing Returns (%) YTD 6-M 1-Y 3-Y 5-Y 7-Y 10-Y Fund 2.01 7.04 14.45 16.07 24.27 18.74 15.24 NIFTY 200 TRI 6.53 9.56 12.92 15.44 17.76 14.71 12.44 Category -0.93 4.14 6.32 13.22 20.08 15.91 13.40 Rank within Category 9 8 2 5 3 3 7 Number of funds in category 35 35 34 30 28 26 22 As on Sep 14, 2018
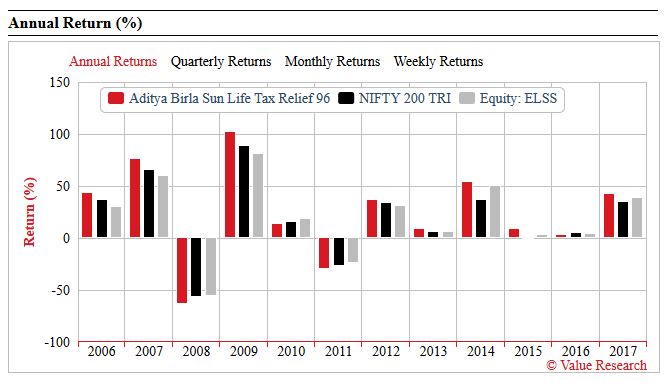
It is interesting that both in 2008 and 2011, the fund fell more than the benchmark. This is a concern., but gets balanced by the outperformance in bull year. So this fund can be in the shortlist.
You can repeat the exercise for the other short listed funds.
OK – Now tell me the best mutual fund
Unlike using ready-made lists, or using the CRISIL ranks, this exercise is more involved if you look at more parameters. You can apply the above approach. You are likely to end with this list of funds:
- ABSL Tax Relief
- Axis LTE
- IDFC Tax Advantage
- DSP Tax Saver
The final choice is yours, and yours alone!


2 thoughts on “Best Mutual Funds – Selection using ValueResearch”