Best Mutual Funds?
‘Best Mutual Fund’ is one of the most common question/search term in personal finance. There are tons of sites that offer a list of Best Mutual Funds, Best Largecap Funds, Best Liquid Funds, etc. Most, but not all, of these sites also list the parameters that they have used to come up with their selection. An earlier post – Best Mutual Funds – Selection Guide– looked at some parameters that can be used to shortlist ‘better’ equity mutual funds. In this article we would look at an easy and quick way to shortlist mutual funds using customized reports and criteria.
First Things First
-
The financial goal that you have
-
Time available to build the corpus
-
Your expected return
-
Your tolerance to volatility
-
Your ability to stay invested and stay focused
-
and more…
As seen in the first post of this series, you can select the mutual fund category first. You can then use these parameters to arrive at a list of ‘best funds’ in that category:
-
Fund Age
-
Annual Returns
- Trailing Returns
- Risk-Return measures
-
Minor factors – AUM size, Expense Ratio, Portfolio Turnover
Most of this article would focus on using the second, third, and fourth factors.
Tools from freefincal.com
A large part of the approach described in this article is derived from the methods and tools in freefincal.com Of the many mutual fund resources in that site, these are most important for our discussion.
- Visualizing Mutual Fund Volatility Measures
- Mutual Fund Risk Return Analyzer – This tool is useful to get more information on the right approach to pick mutual funds. The tool has not been updated with recent category changes
- Monthly Fund Screeners – This is the primary tool for DIY investors to quickly short list a set of mutual funds. The screener is updated monthly and includes the recent changes in category. Due to the focus on direct funds, the performance since 1 Jan 2013 is captured.
- Mutual Fund Lump sum & SIP Screeners – The approach described in this article is illustrated using a modified version of this screener. The screener uses the new categories, but includes performance since 2006
Please spend time to review the above articles, and particularly item d) above. As we discuss the approach, I would note the modifications made to the tool.
Overall Process
- Select the category that you want to analyze
- Screen the funds based on age
- Screen the funds based on Annual Returns
- Screen the funds based on Rolling Returns
- Analyze the risk-return parameters
- If required apply minor parameters – Expense Ratio, AUM size, etc
- Shortlist the fund(s) and start investing
Category screener – CAGR returns
Let us assume that you have selected the mutual fund category. There are many theories that seek to decide the appropriate category for your investment needs and risk profile.
For variety from other selection guides, we would pick the category of mid cap. This category happens to have many funds that have done much better than the benchmark over many years.
For the first part of the analysis, we would use the mutual fund screener. For a large part, the tool compares a fund against its peers. We need to provide just two inputs in the screener.
Note: Please see the end of the article for a short description of the tools used in the analysis.
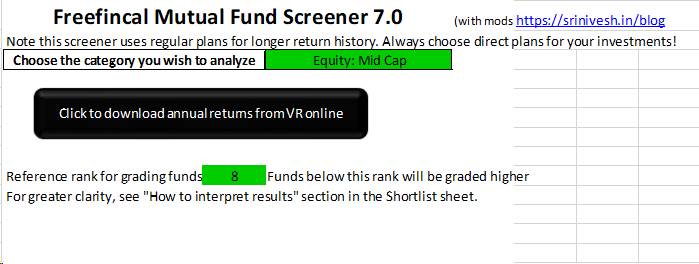
The reference rank for grading funds is quite important. The screener already compares the performance of the fund with the median of the category. So it would be helpful to put a value that is about 1/3 of the total number of funds in the category. So make the selections and click the Big Black button.
The screener downloads the Annual Returns data and uses it to rank the funds. The ‘Shortlist’ tab shows the funds ranked on consistency. Here consistency is defined this way: The percentage of various periods where the fund’s CAGR was among the top N in the category. (Here we have chosen N as 8.) The age of the fund is also given alongside. Here, the report suggests that both Franklin Prima and L&T Midcap have been in the top 8 of the category for 11 out of 12 periods. Invesco Mid Cap has been in the top 8 for 10 out of 11 periods. And so on. (Funds that have a consistency of >= 50% are highlighted in green and funds that have a consistency of < 25% are highlighted in red.)
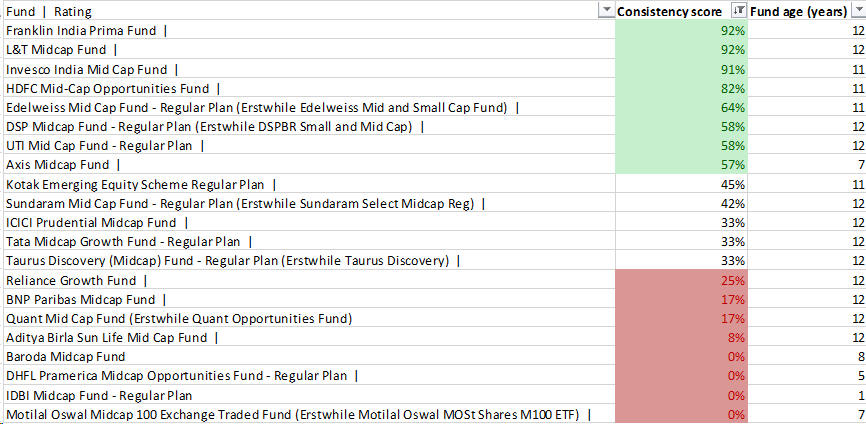
Please note the following points.
- The annual returns are sourced from ValueResearch. You need to log in to the site once from Excel
- Annual returns from 2007 are used – this gives data for 12 years
- As of now, there is no non-AMC source to get NAV and related data before Apr 2006. This is a limitation for most screeners
The data shows some interesting items. There are many funds with history of 12 years or more. Invesco India Mid Cap is placed quite high in the list. Funds from some wel-known AMCs are placed lower in the list.
It is time to look at more data items. The ‘shortlist-category-median’ compares the annual returns with that of the category median. Funds that were in the top half for at least 75% of the periods are highlighted in green.

Category Comparison – Annual Returns
We will wrap up the category comparison by looking at the consistency of annual returns – these are returns from the fund in a specific calendar year. You can look at the ‘shortlist-3’ tab for an ordering of funds based on this.
| No of times the funds annual return was above category median | Years for which annual return data is available | Fund |
| 8 | 11 | Invesco India Mid Cap Fund | |
| 8 | 12 | L&T Midcap Fund | |
| 7 | 11 | Edelweiss Mid Cap Fund – Regular Plan (Erstwhile Edelweiss Mid and Small Cap Fund) | |
| 7 | 12 | Franklin India Prima Fund | |
| 7 | 11 | HDFC Mid-Cap Opportunities Fund | |
| 7 | 11 | Kotak Emerging Equity Scheme Regular Plan | |
| 7 | 12 | Tata Midcap Growth Fund – Regular Plan | |
| 6 | 12 | Aditya Birla Sun Life Mid Cap Fund | |
| 6 | 12 | BNP Paribas Midcap Fund | |
| 6 | 12 | DSP Midcap Fund – Regular Plan (Erstwhile DSPBR Small and Mid Cap) | |
| 6 | 12 | SBI Magnum Midcap Fund | |
| 6 | 12 | Sundaram Mid Cap Fund – Regular Plan (Erstwhile Sundaram Select Midcap Reg) | |
| 6 | 12 | UTI Mid Cap Fund – Regular Plan | |
| 5 | 12 | Quant Mid Cap Fund (Erstwhile Quant Opportunities Fund) |
| 4 | 12 | ICICI Prudential Midcap Fund | |
| 4 | 12 | Reliance Growth Fund | |
The list (only partly shown) is reasonably consistent with the shortlists based on CAGR returns. To reinforce, in the previous section we looked at the relative performance of the fund for 12-year, 11-year, 10-year, etc. anualized returns. In this section, we are looking at the relative performance in each year.
There are 5-7 funds that have performed well across years. For the next step of detailed analysis, we need to use a list of four funds. For the sake of illustration, we would pick from these AMCs: Kotak, Invesco, Franklin, HDFC. (L&T Midcap shold also be in the list; for some reason, the screener has issues getting the full data for the fund and hence I have not included it in the illustrations.)
Note that we have also used the Fund Age criterion. All the shortlists include the period for which returns have been analyzed. All the shortlisted funds have a history of 11 years or more.
Index Comparison – Rolling Returns
In this part, we would do a thorough comparison of the performance of the funds with the appropriate benchmark index. For this we use a custom version of the rolling returns calculator. This heavily modified calculator allows a comparison of upto four mutual funds with a specific index.
For the benchmark index, we have a few choices. The midcap category has a total of 150 stocks – market cap positions 101 to 250. There are indices that track the best 50 from these, 100 from these, etc. For consistency, we use the full midcap index – Nifty Midcap 150 TRI. The input screen looks like this after we have made all the choices.
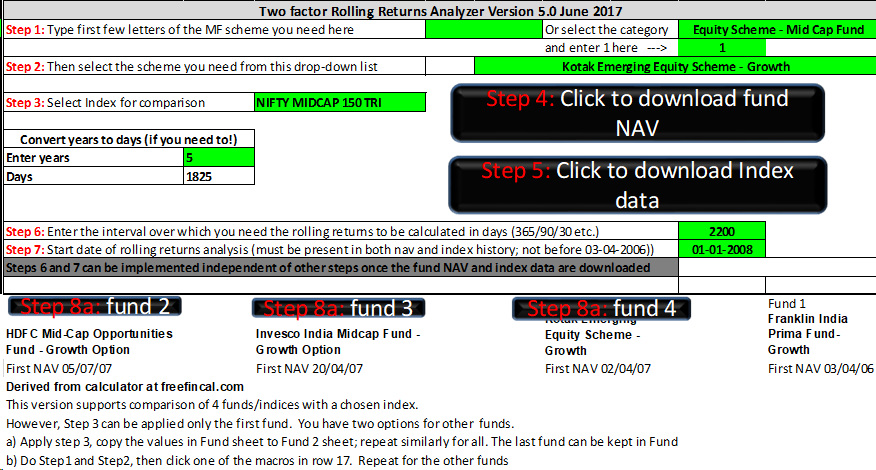
Please note that we can choose the funds in any order. The analysis screens label the data clearly. Please set the start date for the analysis to be later than the start date for the newest fund. You can, and should, use different values for the rolling return period. The screenshot shows the analysis for 2000 days. We use regular plans and have return date for 10 years or more. So you can choose longer periods, from 2 years and above, to analyze the rolling return. As the comments indicate, you can change the rolling return period any number of times without having to download the NAV data again.
We would look at the detailed analysis of 1 year rolling returns. The numbers are displayed in the ‘Analysis’ tab.
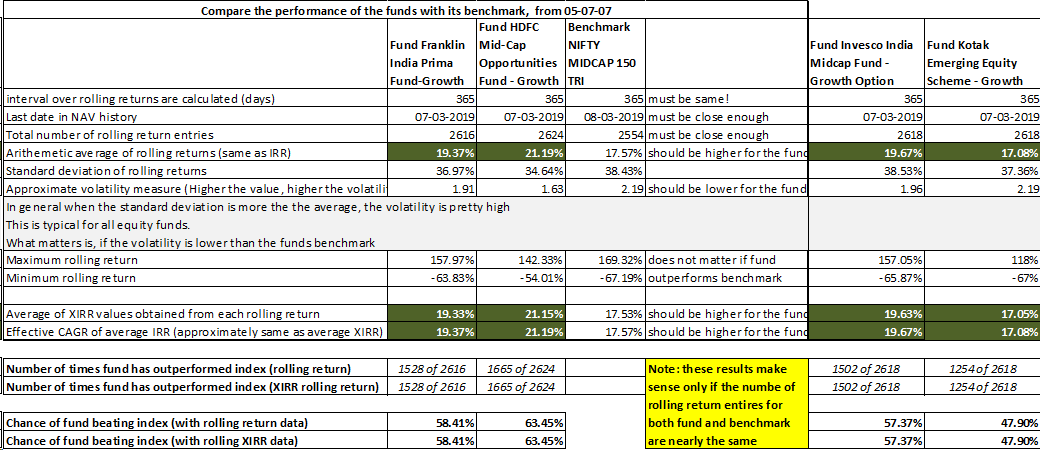
The data may be a bit hard to read. The values in the green fill cells provide the average returns. These along with the approximate volatility give an indication of the risk-adjusted returns. The data clearly shows that all the four funds have outperformed the index; the volatility (measured by standard deviation) has been different for the funds. If you look at 1, 2, 3, etc. rolling year returns, you would see this order of performance.
- HDFC Mid-cap Opportunities Fund
- Franklin Prima
- Invesco Midcap
- Kotak Emerging Equity
There is not a big difference between Franklin Prima and Invesco Midcap. But HDFC Mid-cap has a clear edge over them. The table for 1000 days, and 5 year rolling returns are below.
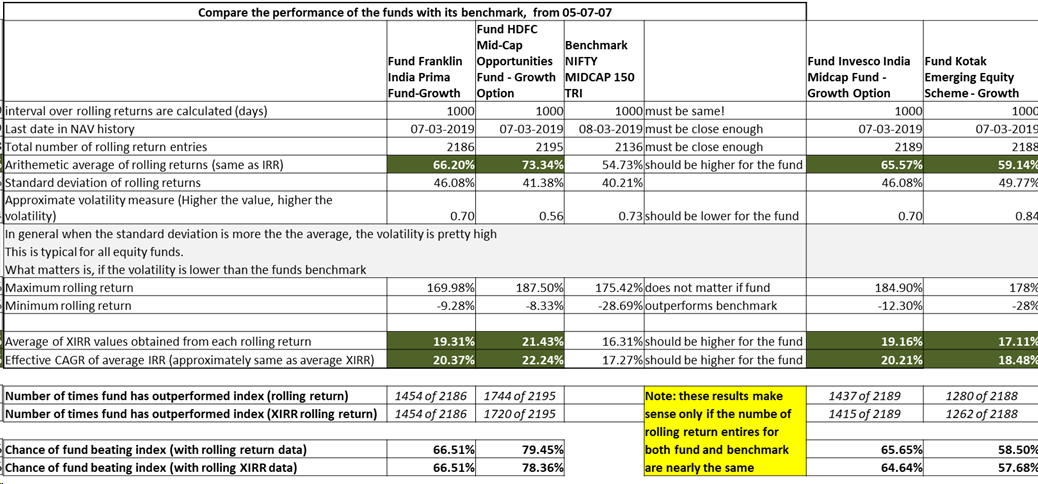
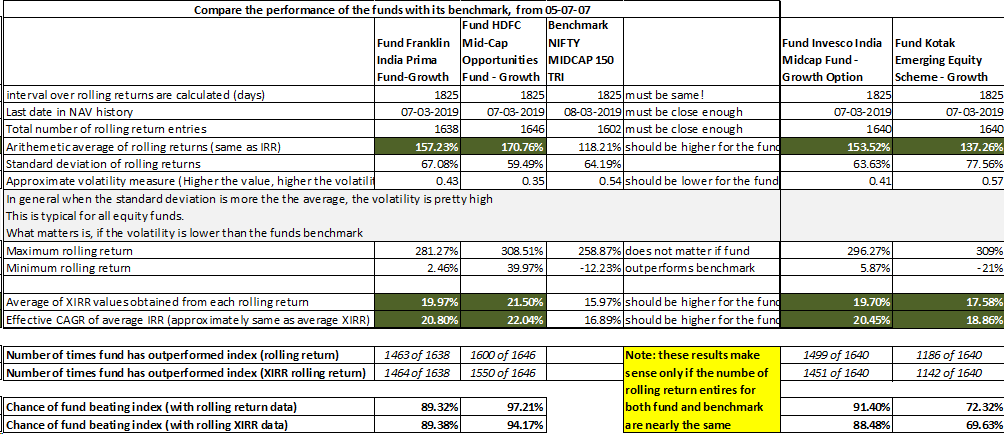
You can get a visual picture of the performance from the two charts – Normalized NAV movement and Rolling Returns.
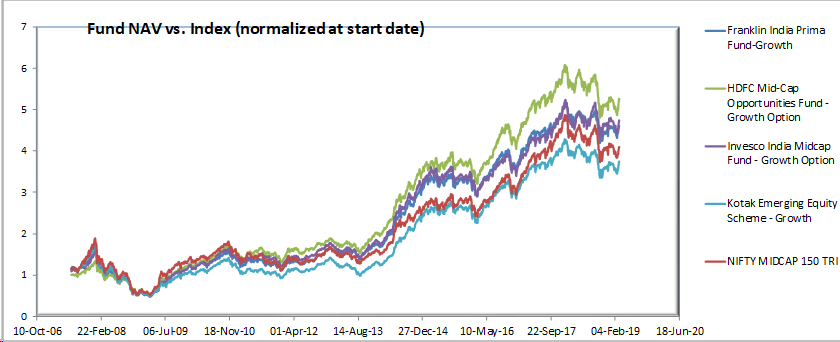
This is broadly in line with the ordering of the funds.
The Rolling Returns graph too suggests a similar order, or does it?
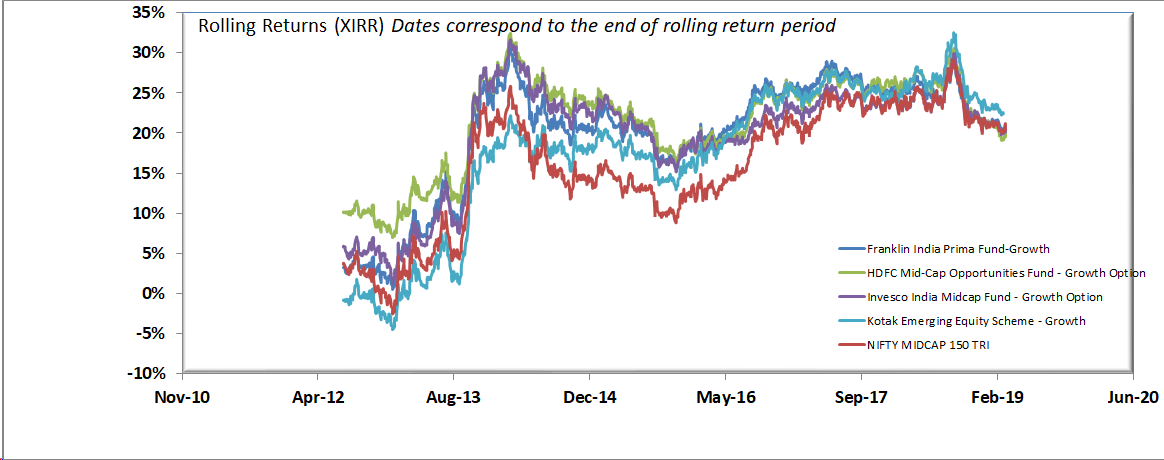
The rolling returns of Kotak’s midcap fund seem to be getting better in recent years. If you set the start date to somewhere in this decade, the rolling returns graph brings this out more clearly.
Due to better performance in recent years, Kotak’s midcap fund would look better if we take more recent years. The Analysis sheet shows this clearly – this fund has closed the gap with others if we take performance from the beginning of 2011.
Of course DIY analysis is not easy. But if you review the steps closely, you can see that we identified the shortlist of funds reasonably quickly. Picking the best among the shortlist takes more time. Instead of looking for the best, if we pick one among the shortlist, we would have a good chance of outperformance over the index.
OK – Now tell me the best mutual fund
As a DIY investor, we can be reasonably certain that a ‘best mutual fund’ does not exist. We have looked at four funds closely and see that any of them can be a good choice. A quick scan in the many published ‘Top mid cap funds’ lists adds more data points to this. Most or all of these four funds figure in these lists.
Tools Used in the analysis
Mutual Fund Screener
This tool is a modified version of the tool described here: Mutual Fund Lump sum & SIP Screeners The modifications are mainly to use manually selected index returns. I hope to add the ability to pull in data from NSE and BSE in a later version of the tool. The modified version of the tool is available here -> Modified Mutual Fund Screener
Rolling Returns Analyzer
This tool is heavily modified from this tool: Multi-index Mutual Fund Rolling Returns Calculator The tool has been updated to reflect the 2018 re-categorization. Selection of funds can be done based on the name or the category. Upto four funds can be selected and compared against any particular index. You can download the file here -> Modified Multi-index Mutual Fund Rolling Returns Calculator The Inputs screen has the instructions for all the changes from the original version of the tool.


Dear Sir,
I found your blog very interesting. Thank you for your insights.
I tried using your modified rolling returns calculator but I am not able to open it after download since the file seems to be corrupted.(excel is showing the message)
Is there any way that I can get a clean file?
Thanks